Using elastic stack for fun and … well more fun.
Why
Earlier this year, in a surprising turn of events, I found myself with a free weekend. Around the same time, I had planned on selling my old car and buying a new one which led to me wanting to know how much I had actually spent on my old car. One thing led to another and I ended up putting in all my car costs in a local elastic instance and graphing a whole lot of metrics about it. Once that was I done, I was curious what else could I graph! And not just once but repeatedly to keep track of. I came up with the following:
– Internet speed, both up and down
– Number of devices that are connected to my local network
– My internet usage, data and otherwise for both internet and phone
– How I spend my money
So, the system setup. Initially I thought I would use
– spinnaker
– google cloud
– jenkins CI
Then I decided, screw that. I have an old mac mini. Lets use cron jobs and simple scripts to do this job. The setup would be simple, a mac mini running three nodes of elastic search, one node of kibana and possibly one node of logstash (the why of which you will find out later in this amazing blog post). All of the data is stored in a separate disk.
Most of the setup follows the pattern of:
1. Obtain data form service in one format
2. Massage data into some meaningful form and save as JSON
3. Load JSON in bulk into elasticsearch
4. Graph into Kibana
So let take this one step at a time.
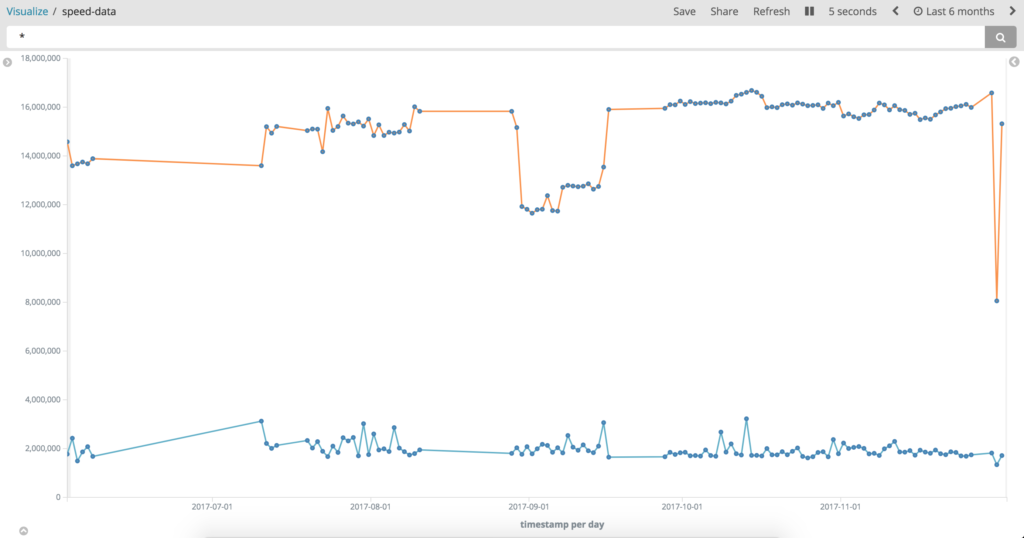
Internet Speed
Usually, whenever I have had to check my internet speed, I simply go to speedtest website and observe my speed. But this needed to be automated and I did not want to have to parse whatever version of flash monstrosity that website uses.
So discovered speedtest-cli and voila, I wrote a small script which pings the speed test endpoint, parses the JSON response and inserts it into elasticsearch. You can use this to compare with what your ISP says you should be getting.


[Fig 1: Last six months worth of speed data. ]
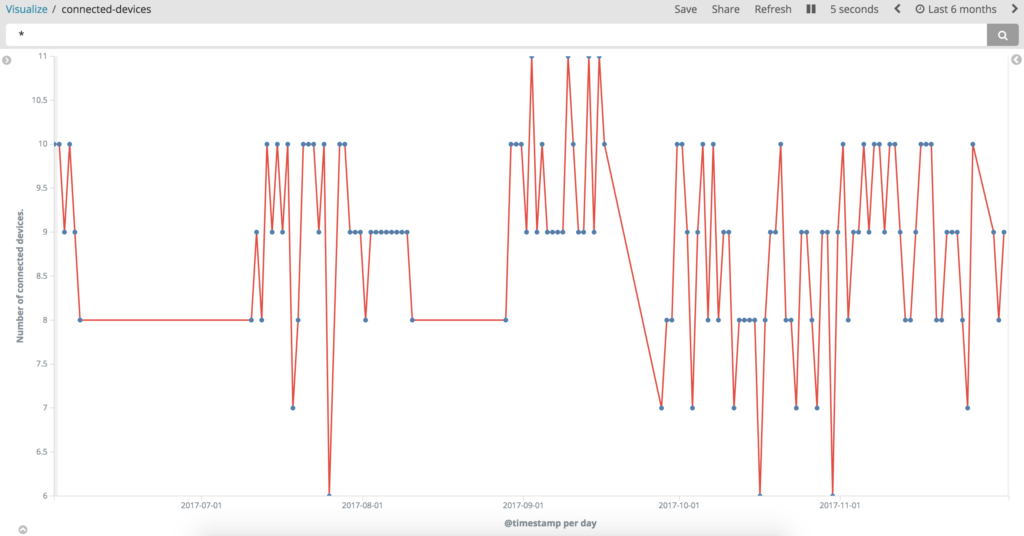
Local subnet map
Initially, I wanted to simply use nmap and parse whatever it gave me. But then a quick google search revealed a setup using log stash. In the interests of laziness, I decided to simply use that setup and not bother with my own parsing of nmap. 🙂


[Fig: Number of devices at any time connected to my local subnet]
Data/Phone usage stats
This one was a bit tricky. Not because I had to write scripts and use elastic, no. This was tricky because I had to write CSS. I hate writing CSS. And CSS hates being written by me. But we decided to put aside our differences and come together for a common cause of pretty graphs. I use vodafone as my phone data and comms provider and as part of their customer portal, My Vodafone, they allow you to download historical data about usage! This includes recipient numbers, time, type (whether call, text or data) etc. They provide it in a CSV file which is easy to parse into elastic consumable JSON. Once the clickety-click of the CSS using webdriver was complete, insertion into elastic search was easy!


[Fig: number of people I called and total data in MB used that day)
For my internet stats, I use the ISP called iinet, and they provide an API to obtain your usage stats. I used that via a simple ruby script and basically gathered my download and upload stats and also keep track of what my IP address is, since i do not have a static IP.

My money spending
I use an service called Get Pocketbook which hooks into your bank account and provides analysis of the way I save ( 🙁 ) and spend ( 😀 ) my money! Just like vodafone, they also provide a way to export your statistics in CSV format (which my bank does not) … and just like vodafone data, you parse that into a JSON payload and insert it into elastic search and you are on your way 🙂 .


[Fig: Save vs Spend data for the last 6 months. Y Extent has been deliberately removed.]
Running these scripts
All of the setup above was achieved via cron jobs. If you are good at writing plist files, then sure go for that can set up a launchd setup. I am not good at plist’s and launchd. So I simply used <code>crontab -e</code> in a shell and wrote a very simple cron examples of the cron can be found on the internet.
*/15 * * * * sh $FULL_PATH/local_subnet.sh >> /tmp/nmap.log 2>&1
*/5 * * * * source $HOME/.rvm/environments/iinet >> ruby $FULL_PATH/isp.rb >> /tmp/iinet.log 2>&1
Some other things I have graphed
– System Memory Stats

– Money spent using the Citylink tollway

– Device variations across my local subnet


End result
One of my many dashboards.

Next steps
Find a way to parse PDF files in an intelligent manner so that I can graph my
– Electricity usage
– Gas usage
– Council rates